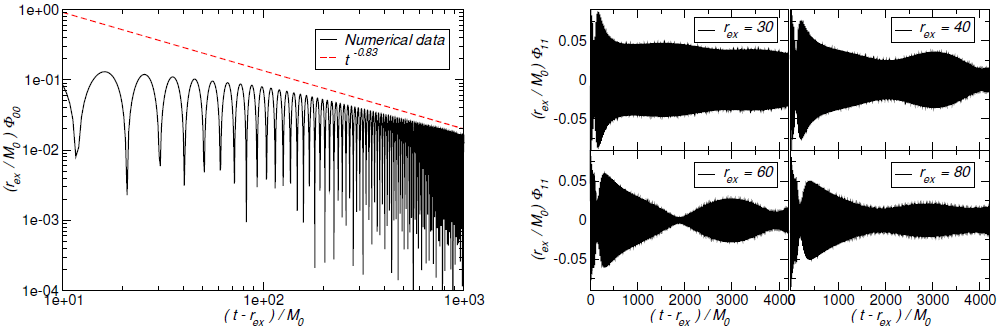
Figure 12: Massive scalar field (nonlinear) evolution of the spacetime of an initially non-rotating BH,
with  . Left panel: Evolution of a spherically symmetric
  scalar waveform,
measured at
scalar waveform,
measured at  , with
  the initial BH mass. In addition to the numerical data (black
solid curve) we show a fit to the late-time tail (red dashed curve) with
the initial BH mass. In addition to the numerical data (black
solid curve) we show a fit to the late-time tail (red dashed curve) with  , in excellent agreement
with linearized analysis. Right panel: The dipole signal resulting from the evolution of an
, in excellent agreement
with linearized analysis. Right panel: The dipole signal resulting from the evolution of an  massive scalar field around a non-rotating BH. The waveforms, extracted at different radii
  exhibit pronounced beating patterns caused by interference of different overtones. The critical feature
is however, that these are extremely long-lived configurations. Image reproduced with permission
from [588], copyright by APS.
exhibit pronounced beating patterns caused by interference of different overtones. The critical feature
is however, that these are extremely long-lived configurations. Image reproduced with permission
from [588], copyright by APS.
. Left panel: Evolution of a spherically symmetric scalar waveform,
measured at , with the initial BH mass. In addition to the numerical data (black
solid curve) we show a fit to the late-time tail (red dashed curve) with , in excellent agreement
with linearized analysis. Right panel: The dipole signal resulting from the evolution of an
massive scalar field around a non-rotating BH. The waveforms, extracted at different radii
exhibit pronounced beating patterns caused by interference of different overtones. The critical feature
is however, that these are extremely long-lived configurations. Image reproduced with permission
from [588], copyright by APS.Vitor Cardoso and Leonardo Gualtieri and Carlos Herdeiro and Ulrich Sperhake, "Exploring New Physics Frontiers Through Numerical
Relativity",
Living Rev. Relativity, 18 (2015), 1, doi:10.1007/lrr-2015-1, URL (accessed <date>): http://www.livingreviews.org/lrr-2015-1.![]() This work is licensed under a Creative Commons Attribution 4.0 International License.
© The author(s), except where otherwise noted.
This work is licensed under a Creative Commons Attribution 4.0 International License.
© The author(s), except where otherwise noted.
Living Rev. Relativity, 18 (2015), 1, doi:10.1007/lrr-2015-1, URL (accessed <date>): http://www.livingreviews.org/lrr-2015-1.