 |
|
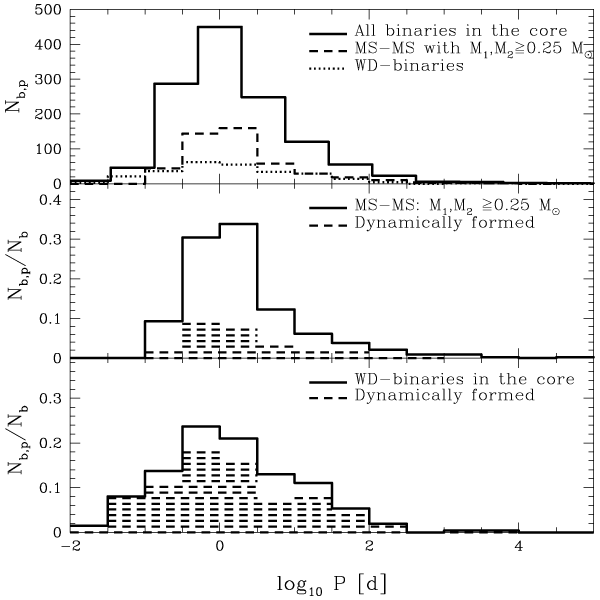
Figure 12: Binary period distributions from the Monte Carlo simulation of binary fraction evolution
in 47 Tuc. The bottom panel indicates the period distribution for binaries containing at least one
white dwarf.
 is the total number of binaries and is the total number of binaries and  is the number of binaries per bin. Image
reproduced by permission from Ivanova et al. [244]. is the number of binaries per bin. Image
reproduced by permission from Ivanova et al. [244]. |
Matthew J. Benacquista and Jonathan M. B. Downing, "Relativistic Binaries in Globular Clusters",
Living Rev. Relativity, 16 (2013), 4, doi:10.12942/lrr-2013-4, URL (accessed <date>): http://www.livingreviews.org/lrr-2013-4. This work is licensed under a Creative Commons License.
© The author(s), except where otherwise noted.
This work is licensed under a Creative Commons License.
© The author(s), except where otherwise noted.
Living Rev. Relativity, 16 (2013), 4, doi:10.12942/lrr-2013-4, URL (accessed <date>): http://www.livingreviews.org/lrr-2013-4.
This work is licensed under a Creative Commons License.
© The author(s), except where otherwise noted.