 |
|
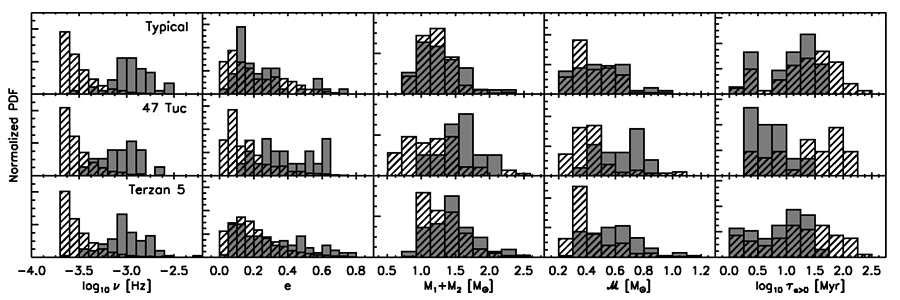
Figure 13: Statistical properties of eccentric DWDs (
 ) in the LISA band ( ) in the LISA band ( )
for three different cluster models. Hatched histograms are for the entire eccentric DWD population
while shaded histograms arefore the DWDs with at least two harmonics individually resolvable by
LISA with an )
for three different cluster models. Hatched histograms are for the entire eccentric DWD population
while shaded histograms arefore the DWDs with at least two harmonics individually resolvable by
LISA with an  (5 year mission, 10 kpc distance). The PDFs are normalized to unity.
From left to right: frequency, eccentricity, total mass, mass ratio and lifetime before merger. Plot
reproduced by permission from Willems et al. 2007 [487], copyright by IOP. (5 year mission, 10 kpc distance). The PDFs are normalized to unity.
From left to right: frequency, eccentricity, total mass, mass ratio and lifetime before merger. Plot
reproduced by permission from Willems et al. 2007 [487], copyright by IOP. |
Matthew J. Benacquista and Jonathan M. B. Downing, "Relativistic Binaries in Globular Clusters",
Living Rev. Relativity, 16 (2013), 4, doi:10.12942/lrr-2013-4, URL (accessed <date>): http://www.livingreviews.org/lrr-2013-4. This work is licensed under a Creative Commons License.
© The author(s), except where otherwise noted.
This work is licensed under a Creative Commons License.
© The author(s), except where otherwise noted.
Living Rev. Relativity, 16 (2013), 4, doi:10.12942/lrr-2013-4, URL (accessed <date>): http://www.livingreviews.org/lrr-2013-4.
This work is licensed under a Creative Commons License.
© The author(s), except where otherwise noted.