3 Local Distance Ladder
3.1 Preliminary remarks
As we have seen, in principle a single object whose spectrum reveals its recession velocity, and whose
distance or luminosity is accurately known, gives a measurement of the Hubble constant. In practice, the
object must be far enough away for the dominant contribution to the motion to be the velocity associated
with the general expansion of the Universe (the “Hubble flow”), as this expansion velocity increases linearly
with distance whereas other nuisance velocities, arising from gravitational interaction with nearby matter,
do not. For nearby galaxies, motions associated with the potential of the local environment are about
 , requiring us to measure distances corresponding to recession velocities of a few
thousand
, requiring us to measure distances corresponding to recession velocities of a few
thousand  or greater. These recession velocities correspond to distances of at least a few tens of
Mpc.
or greater. These recession velocities correspond to distances of at least a few tens of
Mpc.
The Cepheid distance method, used since the original papers by Hubble, has therefore been to measure
distances of nearby objects and use this knowledge to calibrate the brightness of more distant objects
compared to the nearby ones. This process must be repeated several times in order to bootstrap one’s way
out to tens of Mpc, and has been the subject of many reviews and books (see e.g., [176]). The process has a
long and tortuous history, with many controversies and false turnings, and which as a by-product
included the discovery of a large amount of stellar astrophysics. The astrophysical content of the
method is a disadvantage, because errors in our understanding propagate directly into errors
in the distance scale and consequently the Hubble constant. The number of steps involved
is also a disadvantage, as it allows opportunities for both random and systematic errors to
creep into the measurement. It is probably fair to say that some of these errors are still not
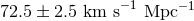
universally agreed on. The range of recent estimates is in the low seventies of  ,
with the errors having shrunk by a factor of two in the last ten years, and the reasons for the
disagreements (in many cases by different analysis of essentially the same data) are often quite
complex.
,
with the errors having shrunk by a factor of two in the last ten years, and the reasons for the
disagreements (in many cases by different analysis of essentially the same data) are often quite
complex.
3.2 Basic principle
We first outline the method briefly, before discussing each stage in more detail. Nearby stars have
a reliable distance measurement in the form of the parallax effect. This effect arises because
the earth’s motion around the sun produces an apparent shift in the position of nearby stars
compared to background stars at much greater distances. The shift has a period of a year,
and an angular amplitude on the sky of the Earth-Sun distance divided by the distance to the
star. The definition of the parsec is the distance which gives a parallax of one arcsecond, and
is equivalent to 3.26 light-years, or  . The field of parallax measurement was
revolutionised by the Hipparcos satellite, which measured thousands of stellar parallax distances,
including observations of 223 Galactic Cepheids; of the Cepheids, 26 yielded determinations of
reasonable significance [63]. The Gaia satellite will increase these by a large factor, probably
observing thousands of Galactic Cepheids and giving accurate distances as well as colours and
metallicities [225].
. The field of parallax measurement was
revolutionised by the Hipparcos satellite, which measured thousands of stellar parallax distances,
including observations of 223 Galactic Cepheids; of the Cepheids, 26 yielded determinations of
reasonable significance [63]. The Gaia satellite will increase these by a large factor, probably
observing thousands of Galactic Cepheids and giving accurate distances as well as colours and
metallicities [225].
Some relatively nearby stars exist in clusters of a few hundred stars known as “open clusters”. These
stars can be plotted on a Hertzsprung–Russell diagram of temperature, deduced from their
colour together with Wien’s law, against apparent luminosity. Such plots reveal a characteristic
sequence, known as the “main sequence” which ranges from red, faint stars to blue, bright stars.
This sequence corresponds to the main phase of stellar evolution which stars occupy for most
of their lives when they are stably burning hydrogen. In some nearby clusters, notably the
Hyades, we have stars all at the same distance and for which parallax effects can give the absolute
distance to  1% [159]. In such cases, the main sequence can be calibrated so that we can
predict the absolute luminosity of a main-sequence star of a given colour. Applying this to other
clusters, a process known as “main sequence fitting”, can also give the absolute distance to these
other clusters; the errors involved in this fitting process appear to be of the order of a few
percent [5].
1% [159]. In such cases, the main sequence can be calibrated so that we can
predict the absolute luminosity of a main-sequence star of a given colour. Applying this to other
clusters, a process known as “main sequence fitting”, can also give the absolute distance to these
other clusters; the errors involved in this fitting process appear to be of the order of a few
percent [5].
The next stage of the bootstrap process is to determine the distance to the nearest objects outside our own Galaxy, the Large and Small Magellanic Clouds. For this we can apply the open-cluster method directly, by observing open clusters in the LMC. Alternatively, we can use calibrators whose true luminosity we know, or can predict from their other properties. Such calibrators must be present in the LMC and also in open clusters (or must be close enough for their parallaxes to be directly measurable).
These calibrators include Mira variables, RR Lyrae stars and Cepheid variable stars, of which Cepheids are intrinsically the most luminous. All of these have variability periods which are correlated with their absolute luminosity (Section 1.1), and in principle the measurement of the distance of a nearby object of any of these types can then be used to determine distances to more distant similar objects simply by observing and comparing the variability periods.
The LMC lies at about 50 kpc, about three orders of magnitude less than that of the distant galaxies of interest for the Hubble constant. However, one class of variable stars, Cepheid variables, can be seen in both the LMC and in galaxies at distances up to 20 – 30 Mpc. The coming of the Hubble Space Telescope has been vital for this process, as only with the HST can Cepheids be reliably identified and measured in such galaxies.
Even the HST galaxies containing Cepheids are not sufficient to allow the measurement of the
universal expansion, because they are not distant enough for the dominant velocity to be the
Hubble flow. The final stage is to use galaxies with distances measured with Cepheid variables to
calibrate other indicators which can be measured to cosmologically interesting distances. The most
promising indicator consists of type Ia supernovae (SNe), which are produced by binary systems in
which a giant star is dumping mass on to a white dwarf which has already gone through its
evolutionary process and collapsed to an electron-degenerate remnant; at a critical point, the
rate and amount of mass dumping is sufficient to trigger a supernova explosion. The physics
of the explosion, and hence the observed light-curve of the rise and slow fall, has the same
characteristic regardless of distance. Although the absolute luminosity of the explosion is not
constant, type Ia supernovae have similar light-curves [163, 8, 209] and in particular there is a
very good correlation between the peak brightness and the degree of fading of the supernova
15 days14
after peak brightness (a quantity known as  [162, 82]). If SNe Ia can be detected in galaxies with
known Cepheid distances, this correlation can be calibrated and used to determine distances to any other
galaxy in which a SN Ia is detected. Because of the brightness of supernovae, they can be observed at large
distances and hence, finally, a comparison between redshift and distance will give a value of the Hubble
constant.
[162, 82]). If SNe Ia can be detected in galaxies with
known Cepheid distances, this correlation can be calibrated and used to determine distances to any other
galaxy in which a SN Ia is detected. Because of the brightness of supernovae, they can be observed at large
distances and hence, finally, a comparison between redshift and distance will give a value of the Hubble
constant.
There are alternative indicators which can be used instead of SNe Ia for determination of  ;
all of them rely on the correlation of some easily observable property of galaxies with their
luminosity or size, thus allowing them to be used as standard candles or rulers respectively. For
example, the edge-on rotation velocity
;
all of them rely on the correlation of some easily observable property of galaxies with their
luminosity or size, thus allowing them to be used as standard candles or rulers respectively. For
example, the edge-on rotation velocity  of spiral galaxies scales with luminosity as
  , a
scaling known as the Tully–Fisher relation [224]. There is an equivalent for elliptical galaxies,
known as the Faber–Jackson relation [58]. In practice, more complex combinations of observed
properties are often used such as the
, a
scaling known as the Tully–Fisher relation [224]. There is an equivalent for elliptical galaxies,
known as the Faber–Jackson relation [58]. In practice, more complex combinations of observed
properties are often used such as the  parameter of [53*] and [128], to generate measurable
properties of elliptical galaxies which correlate well with luminosity, or the “fundamental
plane” [53, 49] between three properties, the average surface brightness within an effective
radius15
the effective radius
parameter of [53*] and [128], to generate measurable
properties of elliptical galaxies which correlate well with luminosity, or the “fundamental
plane” [53, 49] between three properties, the average surface brightness within an effective
radius15
the effective radius  , and the central stellar velocity dispersion
  . Here we can measure surface
brightnesses and
. Here we can measure surface
brightnesses and  and derive a standard ruler in terms of the true
  which can then be compared with
the apparent size of the galaxy.
which can then be compared with
the apparent size of the galaxy.
A somewhat different indicator relies on the fact that the degree to which stars within galaxies are resolved depends on distance, in the sense that closer galaxies have more statistical “bumpiness” in the surface-brightness distribution [219] because of the degree to which Poisson fluctuations in the stellar surface density are visible. This method of surface brightness fluctuation can also be calibrated by Cepheid variables in the nearer galaxies.
3.3 Problems and comments
3.3.1 Distance to the LMC
The LMC distance is probably the best-known, and least controversial, part of the distance ladder. Some
methods of determination are summarised in [62*]; independent calibrations using RR Lyrae variables,
Cepheids and open clusters, are consistent with a distance of  . An early measurement,
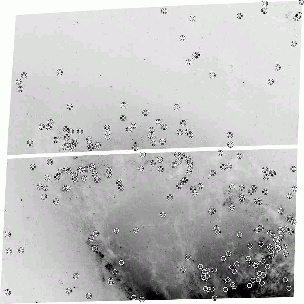
independent of all of the above, was made by [149] using the type II supernova SN 1987A in the
LMC. This supernova produced an expanding ring whose angular diameter could be measured using the
HST. An absolute size for the ring could also be deduced by monitoring ultraviolet emission lines in the ring
and using light travel time arguments, and the distance of
. An early measurement,
independent of all of the above, was made by [149] using the type II supernova SN 1987A in the
LMC. This supernova produced an expanding ring whose angular diameter could be measured using the
HST. An absolute size for the ring could also be deduced by monitoring ultraviolet emission lines in the ring
and using light travel time arguments, and the distance of  followed from comparison of
the two. An extension to this light-echo method was proposed in [200] which exploits the fact
that the maximum in polarization in scattered light is obtained when the scattering angle is
followed from comparison of
the two. An extension to this light-echo method was proposed in [200] which exploits the fact
that the maximum in polarization in scattered light is obtained when the scattering angle is
 . Hence, if a supernova light echo were observed in polarized light, its distance would be
unambiguously calculated by comparing the light-echo time and the angular radius of the polarized
ring.
. Hence, if a supernova light echo were observed in polarized light, its distance would be
unambiguously calculated by comparing the light-echo time and the angular radius of the polarized
ring.
More traditional calibration methods traditionally resulted in distance moduli to the LMC of
 (defined as
  , where
  is the distance in parsecs) corresponding to a distance of
 . In particular, developments in the use of standard-candle stars, main sequence fitting and the
details of SN 1987A are reviewed by [3] who concludes that
. In particular, developments in the use of standard-candle stars, main sequence fitting and the
details of SN 1987A are reviewed by [3] who concludes that  . This has
recently been revised downwards slightly using a more direct calibration using parallax measurements of
Galactic Cepheids [14*] to calibrate the zero-point of the Cepheid P-L relation in the LMC [68*]. A value of
. This has
recently been revised downwards slightly using a more direct calibration using parallax measurements of
Galactic Cepheids [14*] to calibrate the zero-point of the Cepheid P-L relation in the LMC [68*]. A value of
 is found by these authors, corresponding to a distance of
  . The likely
corresponding error in
. The likely
corresponding error in  is well below the level of systematic errors in other parts of the
distance ladder. This LMC distance also agrees well with the value needed in order to make
the Cepheid distance to NGC 4258 agree with the maser distance ([129*], see also
Section 4).
is well below the level of systematic errors in other parts of the
distance ladder. This LMC distance also agrees well with the value needed in order to make
the Cepheid distance to NGC 4258 agree with the maser distance ([129*], see also
Section 4).
3.3.2 Cepheid systematics
The details of the calibration of the Cepheid period-luminosity relation have historically caused the most difficulties in the local calibration of the Hubble constant. There are a number of minor effects, which can be estimated and calibrated relatively easy, and a dependence on metallicity which is a systematic problem upon which a lot of effort has been spent and which is now considerably better understood.
One example of a minor difficulty is a selection bias in Cepheid programmes; faint Cepheids are harder to see. Combined with the correlation between luminosity and period, this means that only the brighter short-period Cepheids are seen, and therefore that the P-L relation in distant galaxies is made artificially shallow [186] resulting in underestimates of distances. Neglect of this bias can give differences of several percent in the answer, and detailed simulations of it have been carried out by Teerikorpi and collaborators (e.g., [214, 152, 153, 154]). Most authors correct explicitly for this problem – for example, [71*] calculate the correction analytically and find a maximum bias of about 3%. Teerikorpi & Paturel suggest that a residual bias may still be present, essentially because the amplitude of variation introduces an additional scatter in brightness at a given period, in addition to the scatter in intrinsic luminosity. How big this bias is is hard to quantify, although it can in principle be eliminated by using only long-period Cepheids at the cost of increases in the random error.
The major systematic difficulty became apparent in studies of the biggest sample of Cepheid
variables, which arises from the OGLE microlensing survey of the LMC [227]. Samples of Galactic
Cepheids have been studied by many authors [62, 75, 67, 10, 13, 108], and their distances can be
calibrated by the methods previously described, or by using lunar-occultation measurements
of stellar angular diameters [66] together with stellar temperatures to determine distances
by Stefan’s law [236, 9]. Comparison of the P-L relations for Galactic and LMC Cepheids,
however, show significant dissimilarities. In all three HST colours ( ,
,  ,
,  ) the slope of the
relations are different, in the sense that Galactic Cepheids are brighter than LMC Cepheids
at long periods and are fainter at short periods. The two samples are of equal brightness in
) the slope of the
relations are different, in the sense that Galactic Cepheids are brighter than LMC Cepheids
at long periods and are fainter at short periods. The two samples are of equal brightness in
 at a period of approximately 30 days, and at a period of a little more than 10 days in
 .16
.16
The culprit for this discrepancy is mainly
metallicity17
differences in the Cepheids, which in turn results from the fact that the LMC is more metal-poor than the
Galaxy. Unfortunately, many of the external galaxies which are to be used for distance determination are
likely to be similar in metallicity to the Galaxy, but the best local information on Cepheids for calibration
purposes comes from the LMC. On average, the Galactic Cepheids tabulated by [81] are of approximately
of solar metallicity, whereas those of the LMC are approximately 0.6 dex less metallic. If these two
samples are compared with their independently derived distances, a correlation of brightness with
metallicity appears with a slope of  using only Galactic Cepheids, and
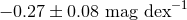 using both samples together. This can cause differences of 10 – 15% in inferred
distance if the effect is ignored.
using both samples together. This can cause differences of 10 – 15% in inferred
distance if the effect is ignored.
Many areas of historic disagreement can be traced back to how this correction is done. In particular, two
different 2005 – 2006 estimates of  (statistical)
  (systematic)
  [170*]
and
[170*]
and  (statistical)
  (systematic)
 [187*], both based
on the same Cepheid photometry from the HST Key Project[178] and essentially
the same Cepheid P-L relation for the LMC [218] have their origin mainly in this
effect.18
One can apply a global correction for metallicity differences between the LMC and the galaxies in which
the Cepheids are measured by the HST Key Project [181*], or attempt to interpolate between
LMC and Galactic P-L relations [211*] using a period-dependent metallicity correction [187*].
The differences in this correction account for the 10 – 15% difference in the resulting value of
[187*], both based
on the same Cepheid photometry from the HST Key Project[178] and essentially
the same Cepheid P-L relation for the LMC [218] have their origin mainly in this
effect.18
One can apply a global correction for metallicity differences between the LMC and the galaxies in which
the Cepheids are measured by the HST Key Project [181*], or attempt to interpolate between
LMC and Galactic P-L relations [211*] using a period-dependent metallicity correction [187*].
The differences in this correction account for the 10 – 15% difference in the resulting value of
 .
.
More recently, a number of different solutions for this problem have been found, which are summarised
in the review by [68] and many of which involve getting rid of the intermediate LMC step using other
calibrations. [129*] use ACS observations of Cepheids in the galaxy NGC 4258, which has a
well-determined distance using maser observations (Section 4, [99, 80, 100*]), and whose Cepheids
have a range of metallicities[242]. Analysis of these Cepheids suggests that the use of a P-L
relation whose slope varies with metallicity [211, 187] overcorrects at long period. Because
of the known maser distance, these Cepheids can then be used both to determine the LMC
distance independently [129] and also to calibrate the SNe distance scale and hence determine
 [173, 172*]. The estimate has been incrementally improved by several methods in the last few
years
[173, 172*]. The estimate has been incrementally improved by several methods in the last few
years
Values obtained for the Hubble constant using the NGC 4258 calibration are quoted by [174*]
as 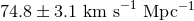 , using a value of 7.28 Mpc as the NGC 4258 distance. This was
later corrected by [100*], who find a distance of
, using a value of 7.28 Mpc as the NGC 4258 distance. This was
later corrected by [100*], who find a distance of  (stat)
  (sys) Mpc using more VLBI
epochs, together with better modelling of the masers, which therefore yields a Hubble constant of
(sys) Mpc using more VLBI
epochs, together with better modelling of the masers, which therefore yields a Hubble constant of
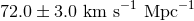 . Efstathiou [54*] has argued for further modifications, with different criteria for
rejecting outlying Cepheids; this lowers
. Efstathiou [54*] has argued for further modifications, with different criteria for
rejecting outlying Cepheids; this lowers  to
to 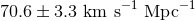 . The alternative distance ladder
measurement, using parallax measurements of Galactic Cepheids [14] gives
. The alternative distance ladder
measurement, using parallax measurements of Galactic Cepheids [14] gives 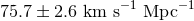 ,
and using the best available sample of LMC Cepheids observed in the infrared [160] yields
,
and using the best available sample of LMC Cepheids observed in the infrared [160] yields
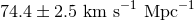 . Infrared observations are important because they reduce the potential error
involved in extinction corrections. Indeed, the Carnegie Hubble Programme [69*] takes this further
by using mid-IR observations (at 3.6
. Infrared observations are important because they reduce the potential error
involved in extinction corrections. Indeed, the Carnegie Hubble Programme [69*] takes this further
by using mid-IR observations (at 3.6  m) of the Benedict et al. Galactic Cepheids with
measured parallaxes, thus anchoring the calibration of the mid-IR P-L relation in these objects,
and obtaining
m) of the Benedict et al. Galactic Cepheids with
measured parallaxes, thus anchoring the calibration of the mid-IR P-L relation in these objects,
and obtaining  . In the mid-IR, as well as smaller extinction
corrections, metallicity effects are also generally less. However, arguments for lower values based on
different outlier rejection can give a combined estimate for the three different calibrations [54] of
. In the mid-IR, as well as smaller extinction
corrections, metallicity effects are also generally less. However, arguments for lower values based on
different outlier rejection can give a combined estimate for the three different calibrations [54] of
 .
.
3.3.3 SNe Ia systematics
The calibration of the type Ia supernova distance scale, and hence  , is affected by the selection of
galaxies used which contain both Cepheids and historical supernovae. Riess et al. [170*] make the case for
the exclusion of a number of older supernovae from previous samples with measurements on photographic
plates. Their exclusion, leaving four calibrators with data judged to be of high quality, has the effect of
shrinking the average distances, and hence raising
, is affected by the selection of
galaxies used which contain both Cepheids and historical supernovae. Riess et al. [170*] make the case for
the exclusion of a number of older supernovae from previous samples with measurements on photographic
plates. Their exclusion, leaving four calibrators with data judged to be of high quality, has the effect of
shrinking the average distances, and hence raising  , by a few percent. Freedman et al. [71] included six
galaxies including SN 1937C, excluded by [170*], but obtained approximately the same value for
, by a few percent. Freedman et al. [71] included six
galaxies including SN 1937C, excluded by [170*], but obtained approximately the same value for
 .
.
Since SNe Ia occur in galaxies, their brightnesses are likely to be altered by extinction in the host galaxy. This effect can be assessed and, if necessary, corrected for, using information about SNe Ia colours in local SNe. The effect is found to be smaller than other systematics within the distance ladder [172].
Further possible effects include differences in SNe Ia luminosities as a function of environment. Wang et
al. [234] used a sample of 109 supernovae to determine a possible effect of metallicity on SNe Ia luminosity,
in the sense that supernovae closer to the centre of the galaxy (and hence of higher metallicity) are brighter.
They include colour information using the indicator  , the
, the  colour at 12 days after maximum, as a means of reducing scatter in the relation between peak
luminosity and
colour at 12 days after maximum, as a means of reducing scatter in the relation between peak
luminosity and  which forms the traditional standard candle. Their value of
  is,
however, quite close to the Key Project value, as they use the four galaxies of [170] to tie the
supernova and Cepheid scales together. This closeness indicates that the SNe Ia environment
dependence is probably a small effect compared with the systematics associated with Cepheid
metallicity.
is,
however, quite close to the Key Project value, as they use the four galaxies of [170] to tie the
supernova and Cepheid scales together. This closeness indicates that the SNe Ia environment
dependence is probably a small effect compared with the systematics associated with Cepheid
metallicity.
3.3.4 Other methods of establishing the distance scale
In some cases, independent distances to galaxies are available in the form of studies of the tip of
the red giant branch. This phenomenon refers to the fact that metal-poor, population II red
giant stars have a well-defined cutoff in luminosity which, in the  -band, does not vary much
with nuisance parameters such as stellar population age. Deep imaging can therefore provide
an independent standard candle which can be compared with that of the Cepheids, and in
particular with the metallicity of the Cepheids in different galaxies. The result [181] is again
that metal-rich Cepheids are brighter, with a quoted slope of
-band, does not vary much
with nuisance parameters such as stellar population age. Deep imaging can therefore provide
an independent standard candle which can be compared with that of the Cepheids, and in
particular with the metallicity of the Cepheids in different galaxies. The result [181] is again
that metal-rich Cepheids are brighter, with a quoted slope of 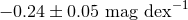 . This
agrees with earlier determinations [111, 107] and is usually adopted when a global correction is
applied.
. This
agrees with earlier determinations [111, 107] and is usually adopted when a global correction is
applied.
Several different methods have been proposed to bypass some of the early rungs of the distance scale and provide direct measurements of distance to relatively nearby galaxies. Many of these are reviewed in the article by Olling [144*].
One of the most promising methods is the use of detached eclipsing binary stars to determine distances
directly [147]. In nearby binary stars, where the components can be resolved, the determination of the
angular separation, period and radial velocity amplitude immediately yields a distance estimate. In
more distant eclipsing binaries in other galaxies, the angular separation cannot be measured
directly. However, the light-curve shapes provide information about the orbital period, the ratio
of the radius of each star to the orbital separation, and the ratio of the stars’ luminosities.
Radial velocity curves can then be used to derive the stellar radii directly. If we can obtain
a physical handle on the stellar surface brightness (e.g., by study of the spectral lines) then
this, together with knowledge of the stellar radius and of the observed flux received from each
star, gives a determination of distance. The DIRECT project [23] has used this method to
derive a distance of  to M33, which is higher than standard distances of
 [70, 124]. It will be interesting to see whether this discrepancy continues after further
investigation.
[70, 124]. It will be interesting to see whether this discrepancy continues after further
investigation.
A somewhat related method, but involving rotations of stars around the centre of a distant galaxy, is the method of rotational parallax [161, 145, 144]. Here one observes both the proper motion corresponding to circular rotation, and the radial velocity, of stars within the galaxy. Accurate measurement of the proper motion is difficult and will require observations from future space missions.
 |
 |
 |