List of Figures
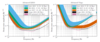 |
Figure 1:
aLIGO (left) and AdV (right) target strain sensitivity as a function of frequency. The binary neutron-star (BNS) range, the average distance to which these signals could be detected, is given in megaparsec. Current notions of the progression of sensitivity are given for early, mid and late commissioning phases, as well as the final design sensitivity target and the BNS-optimized sensitivity. While both dates and sensitivity curves are subject to change, the overall progression represents our best current estimates. |
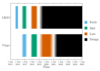 |
Figure 2:
The planned sensitivity evolution and observing runs of the aLIGO and AdV detectors over the coming years. The colored bars show the observing runs, with the expected sensitivities given by the data in Figure 1. There is significant uncertainty in the start and end times of the observing runs, especially for those further in the future, and these could move forward or backwards by a few months relative to what is shown above. The plan is summarised in Section 2.2. |
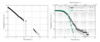 |
Figure 3:
False alarm rate versus detection statistic for compact binary coalescence (CBC) and burst searches on 2009 – 2010 LIGO–Virgo data. Left: Cumulative rate of background events for a subset of the CBC search parameter space, as a function of the threshold ranking statistic  [19]. Different
methods were used to estimate the background for rate for high and low [19]. Different
methods were used to estimate the background for rate for high and low  , which is why there is
an apparent gap in the data points. The background for the full search was approximately a factor
of six higher. Right: Cumulative rate of background events for the burst search, as a function of the
coherent network amplitude , which is why there is
an apparent gap in the data points. The background for the full search was approximately a factor
of six higher. Right: Cumulative rate of background events for the burst search, as a function of the
coherent network amplitude  [14]. For ease of comparison, we have also plotted the approximate
equivalent [14]. For ease of comparison, we have also plotted the approximate
equivalent  for the burst search (an exact identification is not possible as the search methods
differ). The burst events are divided into two sets based on their central frequency. for the burst search (an exact identification is not possible as the search methods
differ). The burst events are divided into two sets based on their central frequency. |
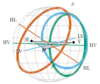 |
Figure 4:
Source localization by triangulation for the aLIGO–AdV network. The locations of the three detectors are indicated by black dots, with LIGO Hanford labeled H; LIGO Livingston as L, and Virgo as V. The locus of constant time delay (with associated timing uncertainty) between two detectors forms an annulus on the sky concentric about the baseline between the two sites (labeled by the two detectors). For three detectors, these annuli may intersect in two locations. One is centered on the true source direction (  ), while the other ( ), while the other ( ) is its mirror image with respect
to the geometrical plane passing through the three sites. For four or more detectors there is a unique
intersection region of all of the annuli. Figure adapted from [41]. ) is its mirror image with respect
to the geometrical plane passing through the three sites. For four or more detectors there is a unique
intersection region of all of the annuli. Figure adapted from [41]. |
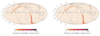 |
Figure 5:
Posterior probability density for sky location for an example binary neutron-star coalescence observed with a two-detector network. Left: Map produced by the low-latency bayestar code [99, 98]. Right: Map produced by the higher-latency (non-spinning) LALInference [110], which also produces posterior estimates for other parameters. These algorithms are discussed in Section 3.2.1. The star indicates the true source location. The event has a network signal-to-noise ratio of  using a noise curve appropriate for the first aLIGO run (O1,
see Section 4.1). The plot is a Mollweide projection in geographic coordinates. Image reproduced
with permission from [31], copyright by APS; further mock sky maps for the first two observing
runs can be found at using a noise curve appropriate for the first aLIGO run (O1,
see Section 4.1). The plot is a Mollweide projection in geographic coordinates. Image reproduced
with permission from [31], copyright by APS; further mock sky maps for the first two observing
runs can be found at  www.ligo.org/scientists/first2years/ for binary neutron-star signals and
www.ligo.org/scientists/burst-first2years/ for burst signals. www.ligo.org/scientists/first2years/ for binary neutron-star signals and
www.ligo.org/scientists/burst-first2years/ for burst signals. |
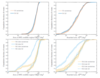 |
Figure 6:
Anticipated binary neutron-star sky localization during the first two observing runs (top: O1, see Section 4.1; bottom: O2, see Section 4.2). The plots show the cumulative fractions of events with sky-localization areas smaller than the abscissa value. Left: Sky area of 90% credible region  , the (smallest) area enclosing 90% of the total posterior probability. Right: Searched area , the (smallest) area enclosing 90% of the total posterior probability. Right: Searched area
 , the area of the smallest credible region containing the true position. Results are shown
for the low-latency bayestar [98] and higher-latency (non-spinning) LALInference (LI) [110]
codes. The O2 results are divided into those where two detectors (2-det) are operating in coincidence,
and those where three detectors (3-det) are operating: assuming a duty cycle of , the area of the smallest credible region containing the true position. Results are shown
for the low-latency bayestar [98] and higher-latency (non-spinning) LALInference (LI) [110]
codes. The O2 results are divided into those where two detectors (2-det) are operating in coincidence,
and those where three detectors (3-det) are operating: assuming a duty cycle of  80% for each
instrument, the two-detector network would be operating for 80% for each
instrument, the two-detector network would be operating for  40% of the total time and the
three-detector network 40% of the total time and the
three-detector network  50% of the time. The shaded areas indicate the 68% confidence intervals
on the cumulative distributions. A detection threshold of a signal-to-noise ratio of 12 is used and
results are taken from [31, 99]. 50% of the time. The shaded areas indicate the 68% confidence intervals
on the cumulative distributions. A detection threshold of a signal-to-noise ratio of 12 is used and
results are taken from [31, 99]. |
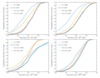 |
Figure 7:
Simulated sky localization for Gaussian (G; top left), sine–Gaussian (SG; top right), broadband white-noise (WN; bottom left) and binary black-hole (BBH; bottom right) bursts during the first two observing runs (O1, see Section 4.1, and O2, see Section 4.2). The plots show the cumulative fractions of events with searched areas  smaller than the abscissa value. Results
are shown for the low-latency coherent WaveBurst (cWB) [70, 71, 73] and higher-latency
LALInferenceBurst (LIB) [110] codes. The O2 results consider only a three-detector (3-det)
network; assuming an instrument duty cycle of smaller than the abscissa value. Results
are shown for the low-latency coherent WaveBurst (cWB) [70, 71, 73] and higher-latency
LALInferenceBurst (LIB) [110] codes. The O2 results consider only a three-detector (3-det)
network; assuming an instrument duty cycle of  80%, this would be operational 80%, this would be operational  50% of
the time. The shaded areas indicate the 68% confidence intervals on the cumulative distributions.
A detection threshold of a false alarm rate of approximately 50% of
the time. The shaded areas indicate the 68% confidence intervals on the cumulative distributions.
A detection threshold of a false alarm rate of approximately  is used and results are taken
from [51]. is used and results are taken
from [51]. |
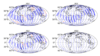 |
Figure 8:
Schematic network sensitivity and localization accuracy for face-on binary neutron-star (BNS) systems with advanced-detector networks. The ellipses show 90% confidence localization areas based upon timing triangulation alone, and the red crosses show regions of the sky where the signal would not be confidently detected. The top two plots show the localization expected for a BNS system at 80 Mpc by the LIGO Hanford (H)–LIGO Livingston (L)–Virgo (V) network (HLV) in the 2016 – 2017 run (left) and 2017 – 2018 run (right). The bottom two plots show the localization expected for a BNS system at 160 Mpc by the HLV network in the 2019+ run (left) and by the four-detector network (HILV) comprising three LIGO sites – in Hanford, Livingston and India (I) – and Virgo operating in 2022+ with all detectors at final design sensitivity (right). The inclusion of a fourth site in India provides good localization over the whole sky. |