 |
|
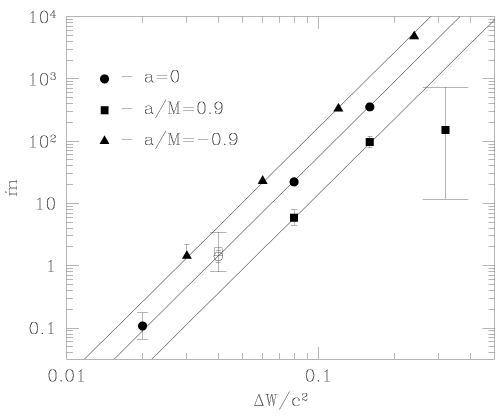
Figure 15: Time-average mass accretion rate
 as a function of the energy gap as a function of the energy gap  for models with
  (circles), (circles),  (squares), and (squares), and  (triangles). The bars
show the variability of (triangles). The bars
show the variability of  . The lines represent the predicted dependencies . The lines represent the predicted dependencies  ,
where ,
where  is the adiabatic index. Image reproduced by permission from [137], copyright by
RAS. is the adiabatic index. Image reproduced by permission from [137], copyright by
RAS. |
Marek A. Abramowicz and P. Chris Fragile, "Foundations of Black Hole Accretion Disk Theory",
Living Rev. Relativity, 16 (2013), 1, doi:10.12942/lrr-2013-1, URL (accessed <date>): http://www.livingreviews.org/lrr-2013-1. This work is licensed under a Creative Commons License.
© The author(s), except where otherwise noted.
This work is licensed under a Creative Commons License.
© The author(s), except where otherwise noted.
Living Rev. Relativity, 16 (2013), 1, doi:10.12942/lrr-2013-1, URL (accessed <date>): http://www.livingreviews.org/lrr-2013-1.
This work is licensed under a Creative Commons License.
© The author(s), except where otherwise noted.