 |
|
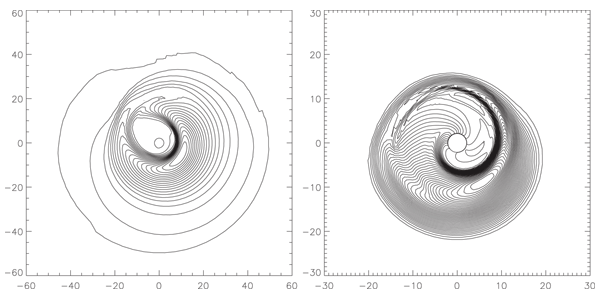
Figure 16: Equatorial slice through hydrodynamic tori at saturation of the Papaloizou–Pringle
instability showing formation of significant non-axisymmetric (
 ) overdensity clumps. The
density contours are linearly spaced between ) overdensity clumps. The
density contours are linearly spaced between  and 0.0. This figure represents models A3p (left)
and B3r (right) of [69]. Image reproduced by permission, copyright by AAS. and 0.0. This figure represents models A3p (left)
and B3r (right) of [69]. Image reproduced by permission, copyright by AAS. |
Marek A. Abramowicz and P. Chris Fragile, "Foundations of Black Hole Accretion Disk Theory",
Living Rev. Relativity, 16 (2013), 1, doi:10.12942/lrr-2013-1, URL (accessed <date>): http://www.livingreviews.org/lrr-2013-1. This work is licensed under a Creative Commons License.
© The author(s), except where otherwise noted.
This work is licensed under a Creative Commons License.
© The author(s), except where otherwise noted.
Living Rev. Relativity, 16 (2013), 1, doi:10.12942/lrr-2013-1, URL (accessed <date>): http://www.livingreviews.org/lrr-2013-1.
This work is licensed under a Creative Commons License.
© The author(s), except where otherwise noted.