 |
|
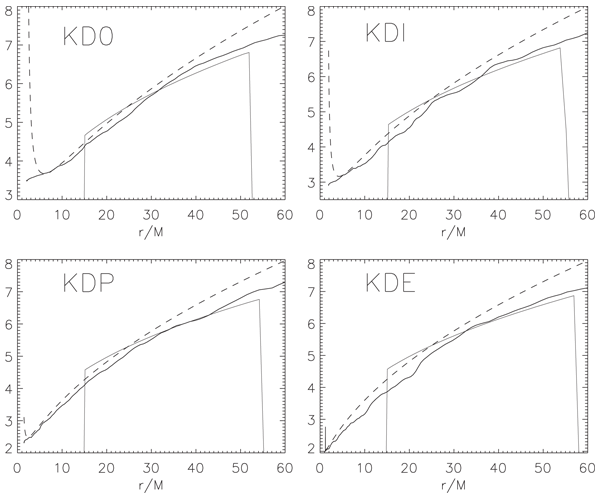
Figure 17: Specific angular momentum
 as a function of radius at as a function of radius at  (thin line) and at (thin line) and at
 orbits (thick line). The individual plots are labeled by model. In each case the Keplerian
distribution for a test particle, orbits (thick line). The individual plots are labeled by model. In each case the Keplerian
distribution for a test particle,  , is shown as a dashed line. Image reproduced by permission
from [72], copyright by AAS. , is shown as a dashed line. Image reproduced by permission
from [72], copyright by AAS. |
Marek A. Abramowicz and P. Chris Fragile, "Foundations of Black Hole Accretion Disk Theory",
Living Rev. Relativity, 16 (2013), 1, doi:10.12942/lrr-2013-1, URL (accessed <date>): http://www.livingreviews.org/lrr-2013-1. This work is licensed under a Creative Commons License.
© The author(s), except where otherwise noted.
This work is licensed under a Creative Commons License.
© The author(s), except where otherwise noted.
Living Rev. Relativity, 16 (2013), 1, doi:10.12942/lrr-2013-1, URL (accessed <date>): http://www.livingreviews.org/lrr-2013-1.
This work is licensed under a Creative Commons License.
© The author(s), except where otherwise noted.