 |
|
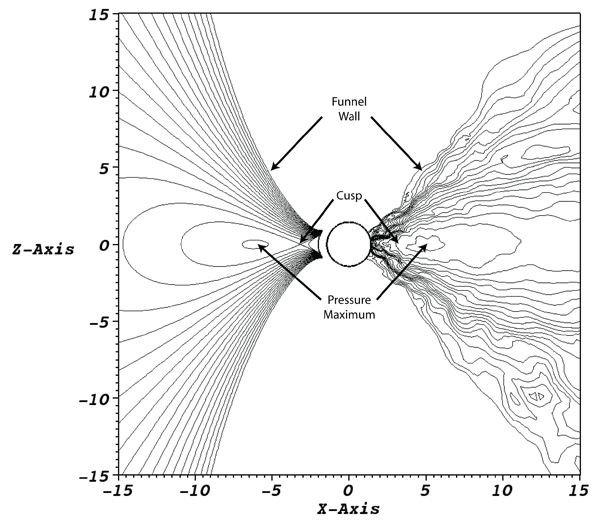
Figure 19: On the left, equidensity contours calculated from an analytic Polish doughnut. On the
right, equidensity contours from a numerical MHD simulation (model 90h from [99]). Note, though,
that the contours on the left are linearly spaced, while those on the right are logarithmically spaced.
Thus, the gradients represented on the left are shallower than those on the right. Image reproduced
by permission from [253], copyright by ESO.
|
Marek A. Abramowicz and P. Chris Fragile, "Foundations of Black Hole Accretion Disk Theory",
Living Rev. Relativity, 16 (2013), 1, doi:10.12942/lrr-2013-1, URL (accessed <date>): http://www.livingreviews.org/lrr-2013-1. This work is licensed under a Creative Commons License.
© The author(s), except where otherwise noted.
This work is licensed under a Creative Commons License.
© The author(s), except where otherwise noted.
Living Rev. Relativity, 16 (2013), 1, doi:10.12942/lrr-2013-1, URL (accessed <date>): http://www.livingreviews.org/lrr-2013-1.
This work is licensed under a Creative Commons License.
© The author(s), except where otherwise noted.