 |
|
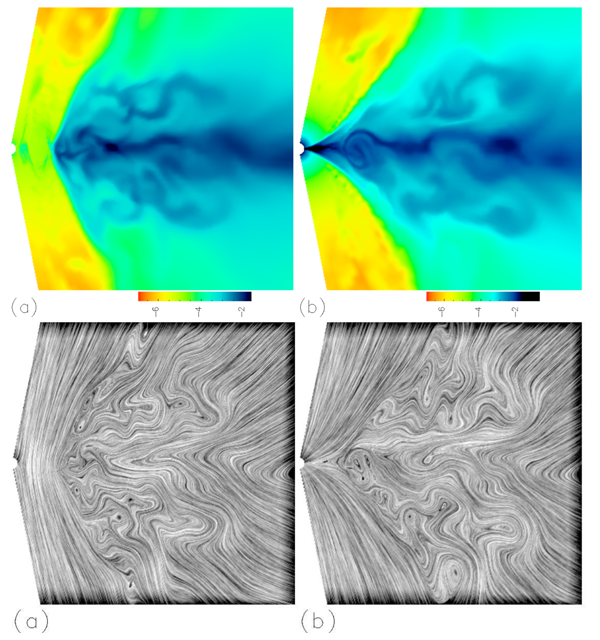
Figure 22: Top: Distributions of density in the meridional plane at different simulation times,
showing a magnetically arrested state (left) and a non-arrested state (right). Bottom: Snapshot
of magnetic field lines at the same simulation times. Image reproduced by permission from [135],
copyright by AAS.
|
Marek A. Abramowicz and P. Chris Fragile, "Foundations of Black Hole Accretion Disk Theory",
Living Rev. Relativity, 16 (2013), 1, doi:10.12942/lrr-2013-1, URL (accessed <date>): http://www.livingreviews.org/lrr-2013-1. This work is licensed under a Creative Commons License.
© The author(s), except where otherwise noted.
This work is licensed under a Creative Commons License.
© The author(s), except where otherwise noted.
Living Rev. Relativity, 16 (2013), 1, doi:10.12942/lrr-2013-1, URL (accessed <date>): http://www.livingreviews.org/lrr-2013-1.
This work is licensed under a Creative Commons License.
© The author(s), except where otherwise noted.