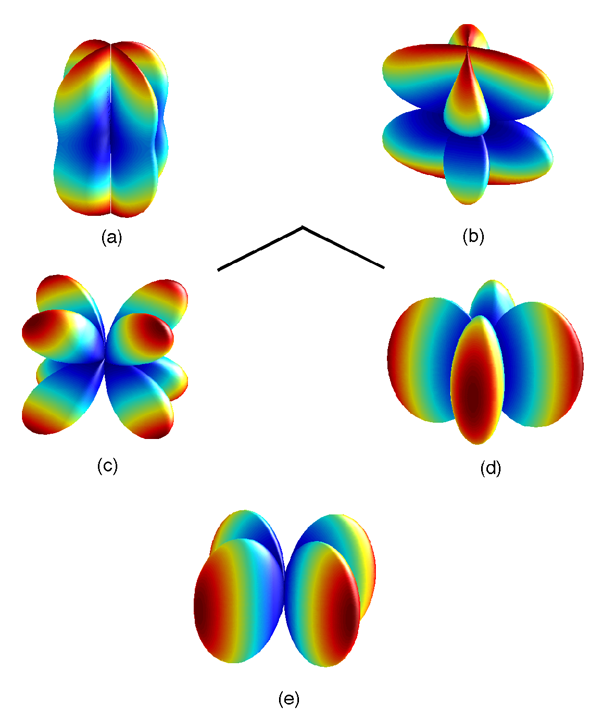
Figure 2: Antenna pattern response functions of an interferometer (see Eqs. (58*)) for  .
Panels (a) and (b) show the plus (
.
Panels (a) and (b) show the plus ( ) and cross (
 ) modes, panels (c) and (d) the vector
x and vector y modes (
) modes, panels (c) and (d) the vector
x and vector y modes ( and
and  ), and panel (e) shows the scalar modes (up to a sign, it is
the same for both breathing and longitudinal). Color indicates the strength of the response with red
being the strongest and blue being the weakest. The black lines near the center give the orientation
of the interferometer arms.
), and panel (e) shows the scalar modes (up to a sign, it is
the same for both breathing and longitudinal). Color indicates the strength of the response with red
being the strongest and blue being the weakest. The black lines near the center give the orientation
of the interferometer arms.
.
Panels (a) and (b) show the plus () and cross () modes, panels (c) and (d) the vector
x and vector y modes ( and ), and panel (e) shows the scalar modes (up to a sign, it is
the same for both breathing and longitudinal). Color indicates the strength of the response with red
being the strongest and blue being the weakest. The black lines near the center give the orientation
of the interferometer arms.Nicolás Yunes and Xavier Siemens, "Gravitational-Wave Tests of General Relativity with
Ground-Based Detectors and Pulsar-Timing Arrays",
Living Rev. Relativity, 16 (2013), 9, doi:10.12942/lrr-2013-9, URL (accessed <date>): http://www.livingreviews.org/lrr-2013-9. This work is licensed under a Creative Commons License.
© The author(s), except where otherwise noted.
This work is licensed under a Creative Commons License.
© The author(s), except where otherwise noted.
Living Rev. Relativity, 16 (2013), 9, doi:10.12942/lrr-2013-9, URL (accessed <date>): http://www.livingreviews.org/lrr-2013-9.
This work is licensed under a Creative Commons License.
© The author(s), except where otherwise noted.