List of Figures
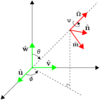 |
Figure 1:
Detector coordinate system and gravitational-wave coordinate system. |
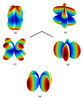 |
Figure 2:
Antenna pattern response functions of an interferometer (see Eqs. (58*)) for  .
Panels (a) and (b) show the plus ( .
Panels (a) and (b) show the plus ( ) and cross ( ) and cross ( ) modes, panels (c) and (d) the vector
x and vector y modes ( ) modes, panels (c) and (d) the vector
x and vector y modes ( and and  ), and panel (e) shows the scalar modes (up to a sign, it is
the same for both breathing and longitudinal). Color indicates the strength of the response with red
being the strongest and blue being the weakest. The black lines near the center give the orientation
of the interferometer arms. ), and panel (e) shows the scalar modes (up to a sign, it is
the same for both breathing and longitudinal). Color indicates the strength of the response with red
being the strongest and blue being the weakest. The black lines near the center give the orientation
of the interferometer arms. |
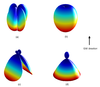 |
Figure 3:
Antenna patterns for the pulsar-Earth system. The plus mode is shown in (a), breathing modes in (b), the vector-x mode in (c), and longitudinal modes in (d), as computed from Eq. (75*). The cross mode and the vector-y mode are rotated versions of the plus mode and the vector-x mode, respectively, so we did not include them here. The gravitational wave propagates in the positive  -direction with the Earth at the origin, and the antenna pattern depends on the pulsar’s location.
The color indicates the strength of the response, red being the largest and blue the smallest. -direction with the Earth at the origin, and the antenna pattern depends on the pulsar’s location.
The color indicates the strength of the response, red being the largest and blue the smallest. |
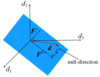 |
Figure 4:
Schematic diagram of the projection of the data stream  orthogonal to the GR subspace
spanned by orthogonal to the GR subspace
spanned by  and and  , along with a perpendicular subspace, for 3 detectors to build the GR
null stream. , along with a perpendicular subspace, for 3 detectors to build the GR
null stream. |
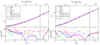 |
Figure 5:
Top: Fitting curves (solid curve) and numerical results (points) of the universal I-Love (left) and Q-Love (right) relations for various equations of state, normalized as  , ,
 and and ![Q¯ = − Q(rot)∕[M 3NS(S∕M N2S )2]](article1242x.gif) , ,  is the neutron-star mass, is the neutron-star mass,  is
the tidal Love number, is
the tidal Love number,  is the rotation-induced quadrupole moment, and is the rotation-induced quadrupole moment, and  is the magnitude
of the neutron-star spin angular momentum. The neutron-star central density is the parameter varied
along each curve, or equivalently the neutron-star compactness. The top axis shows the neutron star
mass for the APR equation of state, with the vertical dashed line showing is the magnitude
of the neutron-star spin angular momentum. The neutron-star central density is the parameter varied
along each curve, or equivalently the neutron-star compactness. The top axis shows the neutron star
mass for the APR equation of state, with the vertical dashed line showing  . Bottom:
Relative fractional errors between the fitting curve and the numerical results. Observe that these
relations are essentially independent of the equation of state, with loss of universality at the 1% level.
Image reproduced by permission from [452], copyright by APS. . Bottom:
Relative fractional errors between the fitting curve and the numerical results. Observe that these
relations are essentially independent of the equation of state, with loss of universality at the 1% level.
Image reproduced by permission from [452], copyright by APS. |
Nicolás Yunes and Xavier Siemens, "Gravitational-Wave Tests of General Relativity with
Ground-Based Detectors and Pulsar-Timing Arrays",
Living Rev. Relativity, 16 (2013), 9, doi:10.12942/lrr-2013-9, URL (accessed <date>): http://www.livingreviews.org/lrr-2013-9. This work is licensed under a Creative Commons License.
© The author(s), except where otherwise noted.
This work is licensed under a Creative Commons License.
© The author(s), except where otherwise noted.
Living Rev. Relativity, 16 (2013), 9, doi:10.12942/lrr-2013-9, URL (accessed <date>): http://www.livingreviews.org/lrr-2013-9.
This work is licensed under a Creative Commons License.
© The author(s), except where otherwise noted.